

Financial Charting Library for Stocks, Forex and Crypto
Get Charting Library
Check out the demo
Knowledge base
Documentation
Sample version. Not a real trade. Such functionality is not available in trial version of DXcharts. Please contact us to get more details
Why Our Charts?
business
1 Day Integration
Your team can roll out our chart into production in hours.
Label-Free
Your customers stay with you. We don't add any external links or logos.
Easy Market Data Integration
Seamless integration of a ready-to-go solution. Provide your end-users with futures, equities, indices, FX, and crypto data.
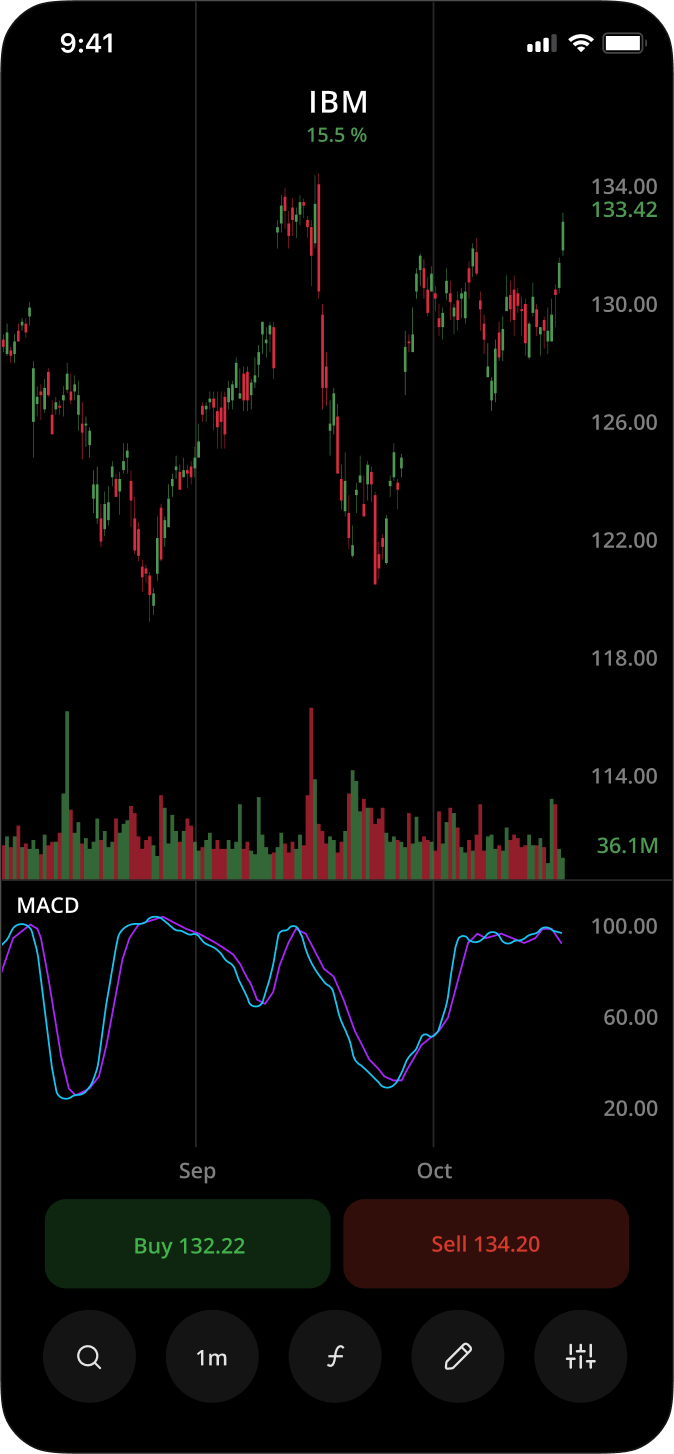
Mobile Version
Access DXcharts anywhere, anytime, with our native mobile application.
technology
Access to Source Code
Create and customize elements. Need something more? Get full access.
Supersonic Fast
Charts stay responsive and nimble even with thousands of bars, hundreds of drawings, and dozens of
indicators.
Developers on Demand
Documentation and support are already part of the deal. Need a team? The same developers who created
the charting library can help integrate it into your app.
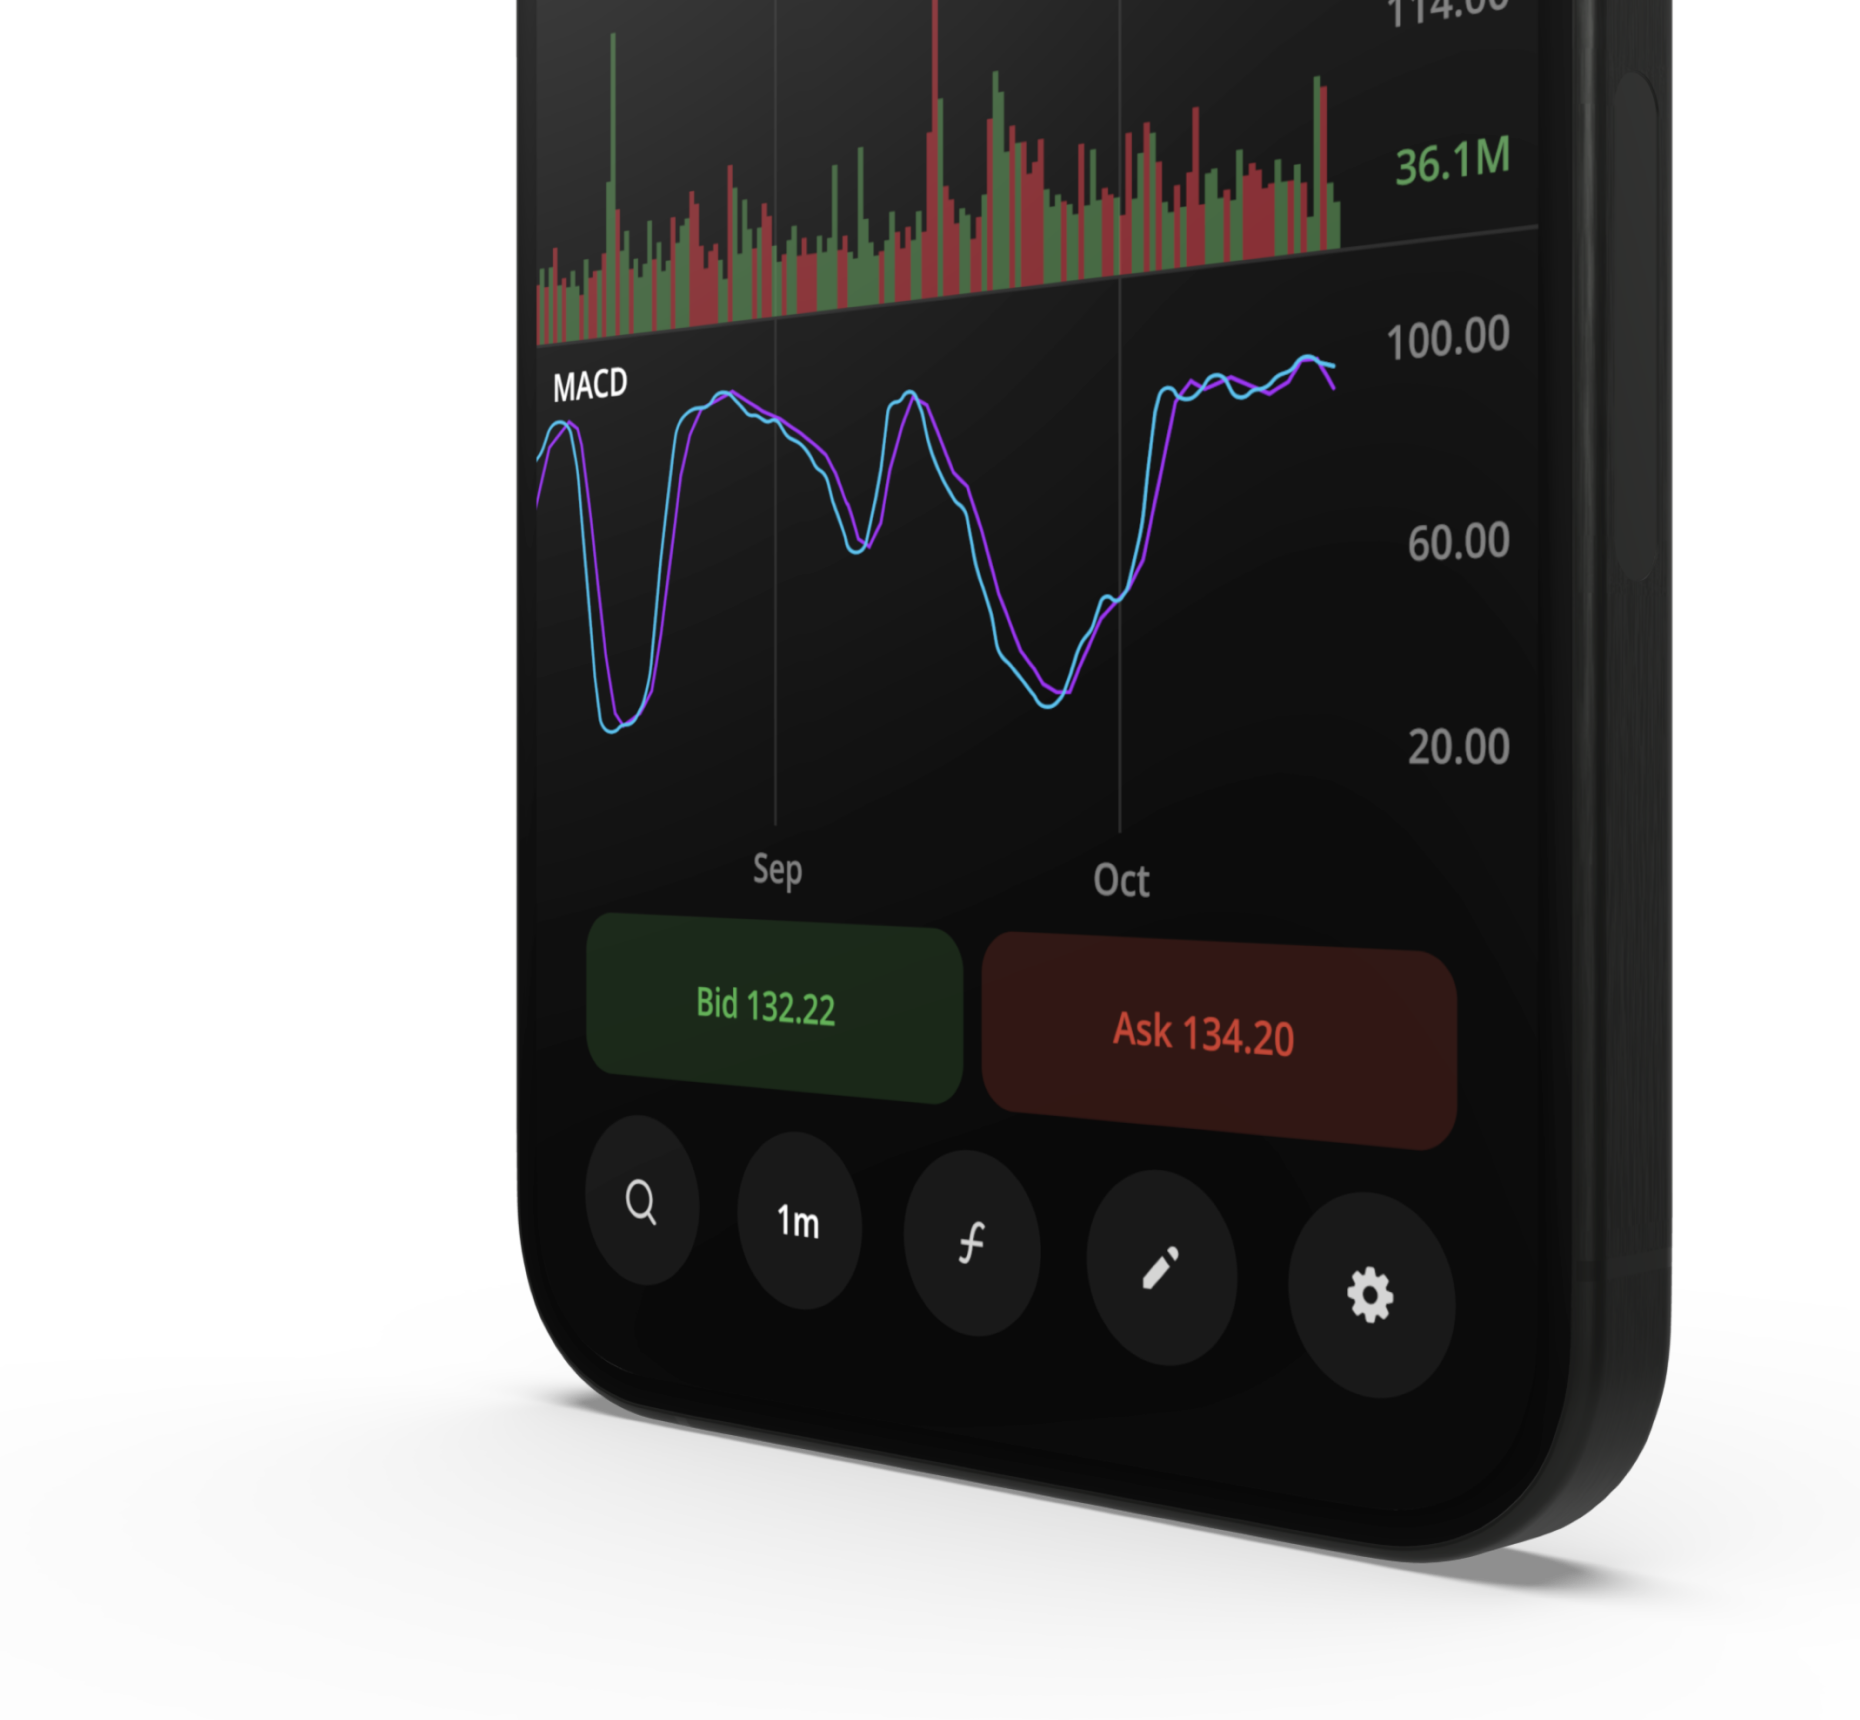
Library for iOS and Android apps
Secure a Competitive Edge With Mobile Charting
- For Native mobile applications
- Written on Swift and Kotlin
- Interactive, agile charting canvas
- Full range of functionality
- Label-free
Key Functionality

Orders & Positions
Work seamlessly with orders and positions directly from the chart. It’s smooth and intuitive. DXcharts
libraries combine best practices from OTC and brokerage platforms.

Diverse Layout
Juggle the layout of charts as you wish. Synchronize them by instrument, chart type, timeframe and
range,
studies, and appearance.

Instrument Comparison
Compare multiple charts and analyze the market situation with simultaneously displayed charts.
Custom Aggregations
Set the chart timeframe to any value and customize the defaults.

Chart Events
View earnings, dividends, splits, or anything else you need for comprehensive analysis.
Various Chart Types
Take advantage of the most popular graphs types to visualize the market.

Extensive Indicator Library
Evaluate securities and forecast their future movement by analyzing statistics gathered from trading
activity. Create custom studies with dxScript.
Drawing Tools
Access 40 trader-preferred drawings for technical analysis and visualization of all known price patterns
Features Comparison
DXcharts
Vendor
Vendor
Vendor
Vendor
Vendor
Vendor
General
DXcharts
Vendor
Vendor
Vendor
Vendor
Vendor
Vendor
Version without branding (logo/watermark)
Responsive for mobile screen
Touch-optimized
Right-click menu
Accessibility-compliant
Saving chart layout
Localization
Charts
DXcharts
Vendor
Vendor
Vendor
Vendor
Vendor
Vendor
Candlesticks
Heikin-Ashi
Histogram
Range (aka points)
Equivolume
Scatterplot
Volume candles
Bars
Area / mountain
Line
Baseline
Hollow candlesticks
Candle trend chart
Multiple Charts Layout
DXcharts
Vendor
Vendor
Vendor
Vendor
Vendor
Vendor
Multiple charts grid
Symbol sync
Aggregation sync
Date range sync
Indicators sync
Drawings
DXcharts
Vendor
Vendor
Vendor
Vendor
Vendor
Vendor
Compare instruments
Amount of drawing tools
40+
30+
50+
20+
Magnet mode
Drawing mode
Studies
DXcharts
Vendor
Vendor
Vendor
Vendor
Vendor
Vendor
Amount of default indicators
100+
100+
100+
40+
Indicator templates
Editor for creating/editing studies
Price Scale
DXcharts
Vendor
Vendor
Vendor
Vendor
Vendor
Vendor
Automatic scale
Manual scale
Left scale
Percent scale
Logarithmic scale
Countdown
Multiple scales
Inverted scale
Locked scale
Aggregations & Timeframes
DXcharts
Vendor
Vendor
Vendor
Vendor
Vendor
Vendor
Configurable default aggregations
N ticks aggregations
Date range
User-customizable aggregations in GUI
Arithmetic operators for custom series
N mins/hours/days/weeks/months/years
N seconds aggregations
Timezone selector
Session breaks
Data
DXcharts
Vendor
Vendor
Vendor
Vendor
Vendor
Vendor
Market data from your provider
Market data integrated out of box
Data export
Data loading by chunks
Instrument search
Events
Trading
DXcharts
Vendor
Vendor
Vendor
Vendor
Vendor
Vendor
Open positions
Active orders
Basic order types (market, limit, stop)
Bracket orders
Appearance
DXcharts
Vendor
Vendor
Vendor
Vendor
Vendor
Vendor
Themes
Custom chart colors
Custom font family
Custom colors for drawings and indicators
Custom colors for toolbars and panels
Sharing
DXcharts
Vendor
Vendor
Vendor
Vendor
Vendor
Vendor
Chart snapshot (image)
Sharing snapshot via Twitter
Sharing snapshot via Telegram

Technology we use
JavaScript
HTML Canvas
TypeScript
Swing
CSS
Java
ReactJS
Android
Scripting Language
iOS
FAQ
Can I connect my data feed to DXcharts?
Yes! Dxcharts is built to be data-agnostic. We also offer DxFeed, with seamless integration into DXcharts.
Where can I see your roadmap?
Reach out to us by filling out the contact form and we will share our roadmap with you.
Can I change the charts’ style based on my company brand?
With DXcharts you can change literally everything in the UI.
What’s the difference between DXcharts and other solutions on the market?
DXcharts libraries combine popular and advanced technologies, outstanding customization capabilities, and extensive documentation. We also offer options with the source code and market data.
What’s the price of DXcharts?
Please fill out the contact form and we will get back to you with all of our distribution options and relevant price tags.
How are trial license periods regulated?
Terms, conditions, and details about DXcharts trial license is governed by the ‘DXcharts Trial License Agreement’ here
Let us help you with your business challenges
Contact us to schedule a call or set up a meeting
Contact Us